

New Metrology Techniques for Advanced Thin Film Optical Filters
Improvements in optical filter performance require improvements in optical filter measurement techniques.
Alluxa’s thin film optical filter technology has advanced to the point where the spectral slopes and blocking levels are challenging even the best metrology equipment and techniques. This paper discusses the issues and provides solutions to measuring the spectral response of this new class of high performance filters.
Filter Spectrum Measurement – Background
The function of a thin film optical filter is to transmit, reflect, or attenuate light over one or more optical wavelength regions. Closely spacing high transmission and high rejection regions increases the measurement difficulty, in particular if the filter is tilted or the rejection zone is required to have high Optical Density (OD) rejection. In today’s advanced filter designs there are often multiple such regions, as for example shown in the first figure previously. Alluxa, with its recent advances in design and coating technology have enabled improvements in most of the optical parameters of these filters, i.e. the transmission can now be made higher, the attenuation or reflection greater, and the width of the transition between them smaller.
In the past the depth of attenuation and the sharpness of the transition were such that it was relatively straightforward to obtain accurate measurements using a white light source and a grating-based instrument such as a spectrophotometer. Today’s filters are now pushing the limits of what even the best commercial spectrophotometers can achieve.
Spectral Measurements and Limitations
The optimum instrument to measure the characteristics of advanced optical filters would consist of a bright monochromatic light source, tunable in wavelength over the region of interest, combined with a detector with high sensitivity (i.e. low noise floor) and high dynamic range. In some wavelength regions, instruments that approach this ideal are readily available. For example, in the 1.5 micron wavelength region used for telecommunications, lasers and detectors are available which enable measurements of changes in transmission of 100dB (10 OD) or greater with wavelength accuracy measured in picometers.
However, for many wavelength ranges of interest, particularly in the visible, practical and affordable tunable lasers are either not available or are available only over a very limited wavelength range. Thus the standard measurement approach is to approximate a monochromatic source by using a broadband light source and filtering the light to a wavelength range narrow enough to resolve the features of interest. Commercial instruments which use this approach typically use a tunable monochromator to filter the spectrum of a light bulb or arc lamp combined with a semiconductor or photomultiplier tube detector. The basic schematic of such an instrument is shown in Figure 1. The use of a diffraction grating-based monochromator, along with the appropriate choice of broadband sources and detectors, allow a single spectrophotometer instrument to cover the entire wavelength region from the UV to the near IR.
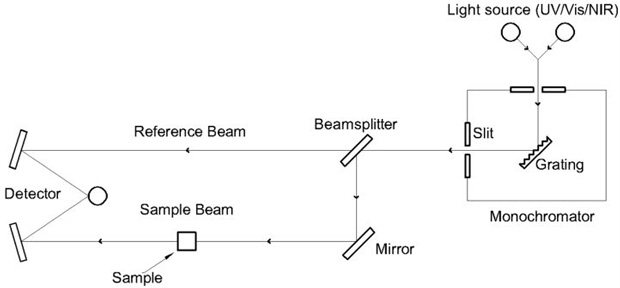
Figure 1. Spectrophotometer schematic
This wide wavelength range along with the high performance of today’s commercial spectrophotometers makes them by far the most popular choice of measurement instrument for production use by optical filter manufacturers. However, the recent improvements in optical filter performance have pushed these instruments to the limit of their ability and forced users to work around their limitations. Ironically, these limitations are related to the spectrophotometers strength, i.e. its wide wavelength range enabled by use of a broadband light source.
For the purposes of this paper we can separate these performance limitations into two main areas: limitations in the spectrum of the filtered source (such as spectral width and brightness) and limitations in the measurement light beam output from the monochromator because of the optics that manipulates it.
The first limitation is well known. The more narrowly one filters a broadband light source, the dimmer the resulting measurement light beam. Thus increasing wavelength resolution decreases the dynamic range of the measurement (assuming source brightness and detector noise floor are fixed). Optical filters are often required to block light to below a part in one million of full transmission over a given wavelength range. That corresponds to an optical density of 6 OD or a 60 dB change in light level. With the new more capable filters this number is increasing to 70 dB, 80 dB, or even 100 dB and greater attenuation.
Today’s high performance commercial spectrophotometers can achieve blocking measurements of this magnitude while maintaining spectral resolution on the order of a nanometer. As an example, Figure 2 shows the wide blocking ranges measured for a series visible bandpass filters used in scientific applications for fluorescence excitation and emission detection. The wide square passband regions with steep sides that quickly drop 60 dB below the peak are typical of what Alluxa achieves with thin film filter technology.
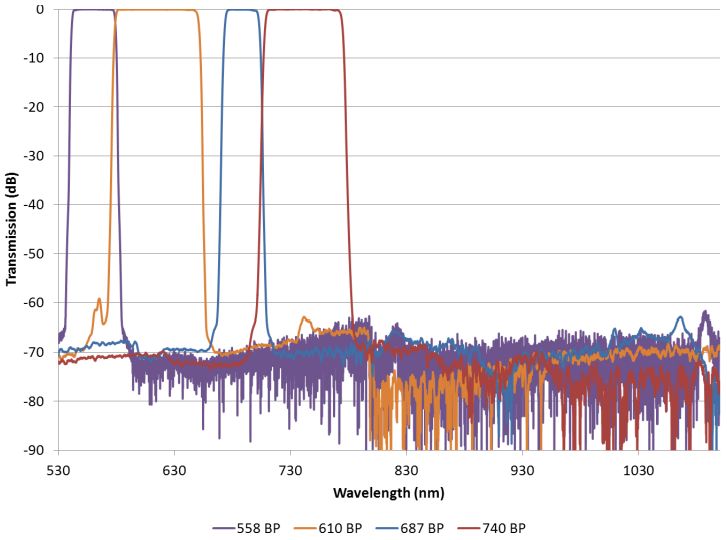
Figure 2. Visible bandpass filters with wide deep blocking ranges.
The measurement difficulties become much more acute in applications requiring very high wavelength resolution, very high dynamic range or both simultaneously. The types of filters which require this measurement capability include those with particularly rapid changes in transmission, such as deep notches, narrow bandpasses, and very steep edge filters.
Optimizing Dynamic Range and Wavelength Resolution
For filters where high wavelength resolution is not required, the dynamic range of measurement can be improved. The slits of the monochromator may be opened wide enough to allow through sufficient light to enable high OD measurements. This works well when the wavelength region of high transmission is small compared with the blocking regions as shown in Figure 3.
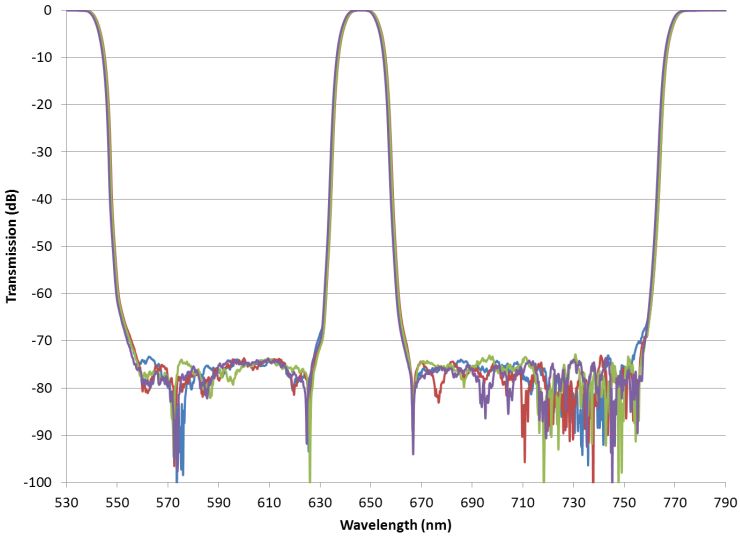
Figure 3. Triband bandpass filters with deep wide blocking regions between relatively narrow passband regions.
The noise floor of the measurements is below -80 dB or 8 OD. In this measurement the slit width of the monochromator was opened wide enough (2nm) and the scan speed was slow enough that sufficient light reached the detector to allow the measurement of the very deep blocking. Note, however, that the wavelength resolution is seriously compromised with these settings, as shown by the rounded top of the passband. Another measurement of the same filter made with a narrow slit width (0.1 nm) shows the true shape in the high transmission region Figure 4.
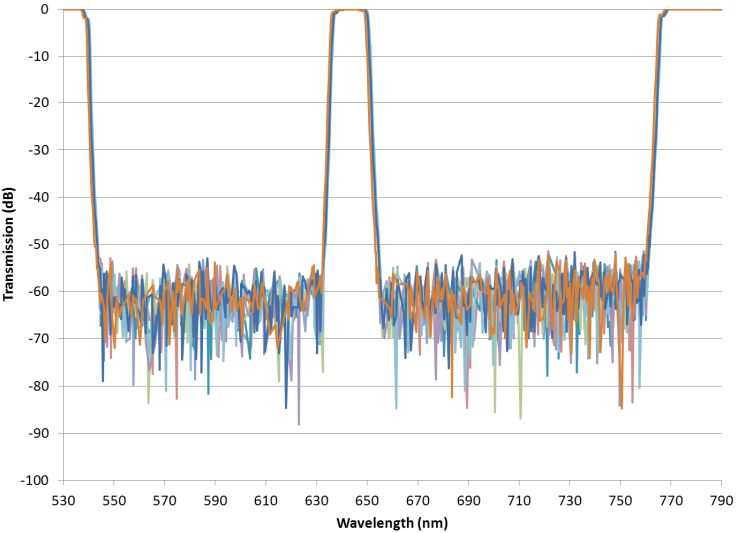
Figure 4. Triband bandpass filters measured with high wavelength resolution.
However, when the blocking region is both deep and narrow then leakage from scattered light can reduce the measured performance significantly. For example, Figure 5 shows a measurement of a narrow notch filter with high transmission extending widely on each side.
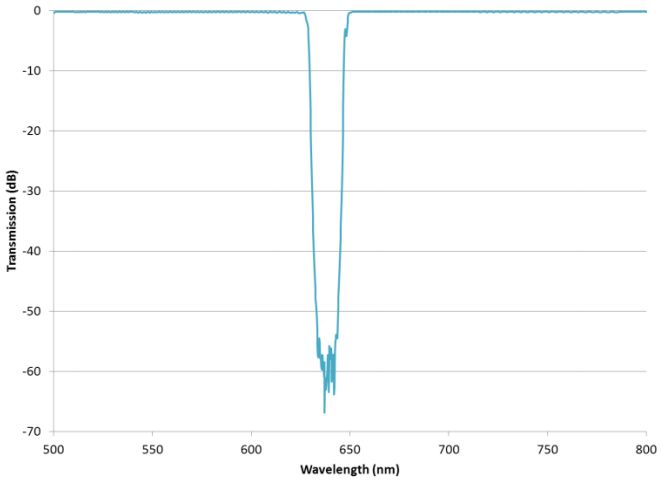
Figure 5. Narrow deep notch with wide transmission window.
Although scattered light from the monochromator is inherently a measurement limitation of these instruments, it may only be significant when measuring certain types of filters. In the case of this filter it is significant because the narrow blocking region means that any scattered light in the high transmission wavelength regions may reach the detector and add to the detected signal. This limits the minimum light level the detector sees when in the blocking region and thus reduces the dynamic range of the detector.
When the light levels after the sample reach very low values, it is often useful to add extra attenuation to the reference path of the spectrophotometer. The reference path signal, as shown in Figure 1, is compared to the sample path signal in making the measurement. If one path is greatly attenuated and the other is not, then the imbalance of the signal levels on the detector (or detectors, if two are used) can add to the noise level, reducing the dynamic range. This is clearly shown in the notch measurement shown in Figure 6, where the two measurements performed were identical except for the insertion into the reference beam of a broadband neutral density filter with an attenuation of 2 OD.
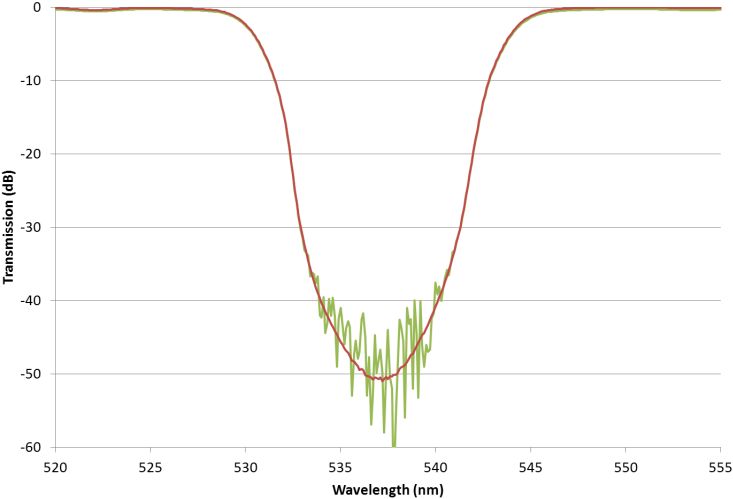
Figure 6. Effect of reference beam attenuation on noise level of deep blocking filters
Dealing with Beam Geometry
The second limitation is due to the beam geometry of the measurement system and is related to the angular content and size of the beam. In a high performance measurement system for telecommunications filters discussed above, fiber optic collimators provide intense, collimated beams (F/#100 or more with beams less than 1mm in diameter) that generally eliminate beam geometry artifacts. In the case of monochromator-based systems which must operate over a wide range of wavelengths, the limitations due to beam geometry can be severe.
The need to collect as much light as possible from the monochromator, to enable high OD measurements, means the beam of light used to measure the sample needs to be large and thus will contain light propagating at a range of angles. Typical values for f/# are around 5 to 8, but can vary in the horizontal and vertical axes. For example, the maximum vertical angle of incidence on the filter to be measured may be over 7 degrees while the horizontal angle is around 3 degrees. Since thin film optical filters shift in wavelength with angle of incidence, this can introduce major measurement errors. And as the rate of spectral shift with angle of thin films increases almost linearly with angle of incidence, filters designed to be used at angle such as dichroic beamsplitters are even more sensitive to measurement beam angular content.
The standard way to tackle this problem is to limit the measurement beam to a smaller range of angles by introducing apertures into the beam. For example, a measurement of a dichroic edge filter made with and without apertures is shown in Figure 7.
Figure 7. Effect of Apertures on Edge Filter.
The rounding of the edge filter shown is not caused by a wide range of wavelengths (the slit width used was 0.1 nm) but by the light at the same narrow wavelength coming in at a relatively large range of angles. Thus the wavelength resolution is independent of that determined by the monochromator slit width. By decreasing the range of angles in the measurement beam the effective wavelength resolution is increased. For narrow filters this can distort the measurement severely as shown for a ~3 nm wide bandpass in Figure 8.
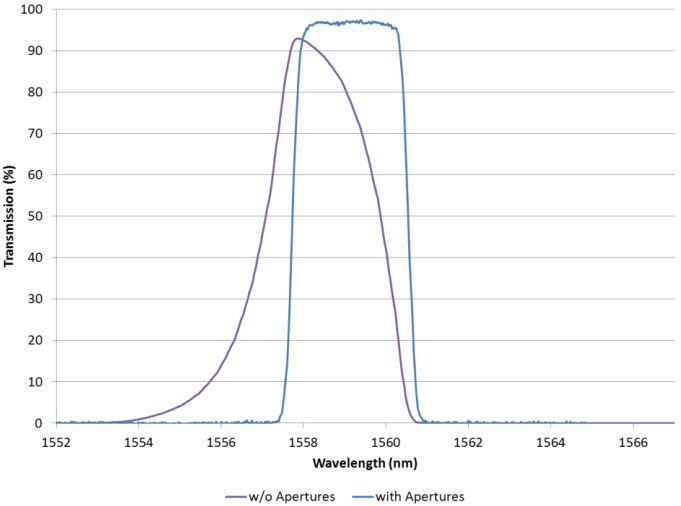
Figure 8. Distortion of narrow bandpass filter as seen by measuring with and without apertures.
As mentioned previously, as the optical filter is tilted, as is common for dichroics and edge filters which are intended to be used at angle, this effect becomes greater. A thin film optical filter shifts to shorter wavelengths as it is tilted and the shift increases with angle roughly as the square root of the difference of the effective index of refraction squared and the sine squared of the angle. Thus the greater the tilt, the greater the shift in wavelength of a filter for a given angular spread in the measurement beam.
One example of the difficulties of measuring filters at angle is shown in Figure 9. This edge filter or dichroic was measured using an aperture at the entrance to the sample chamber in a Cary 5000 spectrophotometer that had an opening of approximately 2mm diameter. A similar size aperture was used at the output of the sample chamber, but at three positions: centered on the measurement beam, one diameter higher, and one diameter lower.
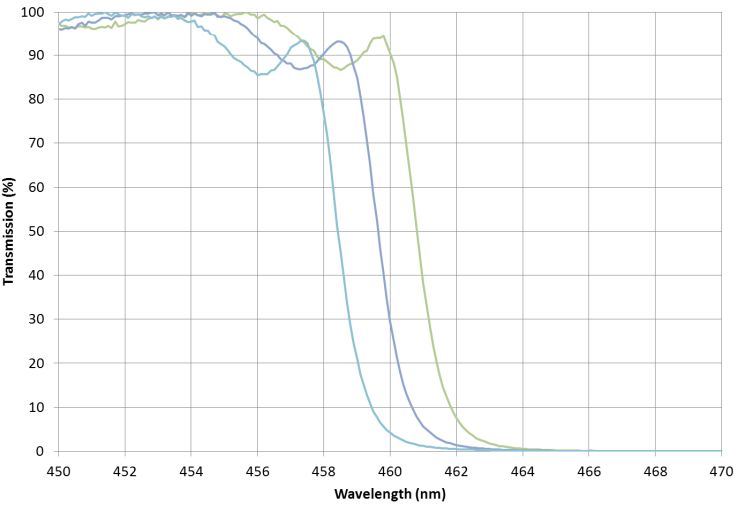
Figure 9. Wavelength shift due to placement of output aperture in measurement beam. The filter was mounted at a tilt of 45 degrees to the measurement beam.
This measurement shift of a few nanometers was often unimportant in the past with its lower performance requirements. With today’s high performance filters and tighter manufacturing tolerances however, it determines whether a part meets or fails customer specifications.
Multiple Passband Filter Measurements
The toughest measurement challenges come when the steep edges and deep blocking are combined multiple times within a single filter in new class of multiband filters pioneered by Alluxa. For example Figure 10 shows a high performance triband filter compared with the theoretical design on a linear scale. Figure 11 is the same filter on a log scale showing that the blocking measurement is limited. This limit could be improved by opening the monochromator slit width and decreasing wavelength resolution, but it would only be improved in the region between the passbands. The blocking value very near the high transmission region would still be unresolved due to the loss in wavelength resolution. Measuring the amount of blocking close to the high transmission regions tests a spectrophotometer measurement system to its limit yet is of critical importance to the filter user.
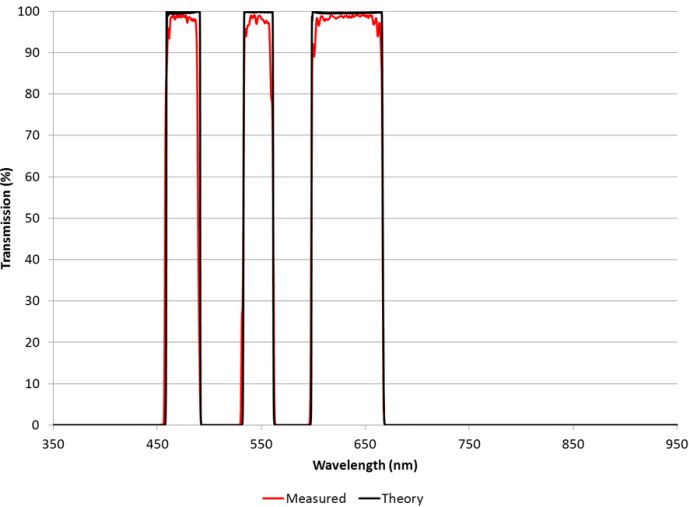
Figure 10. Triband optical filter in the visible showing high transmission and steep slopes.
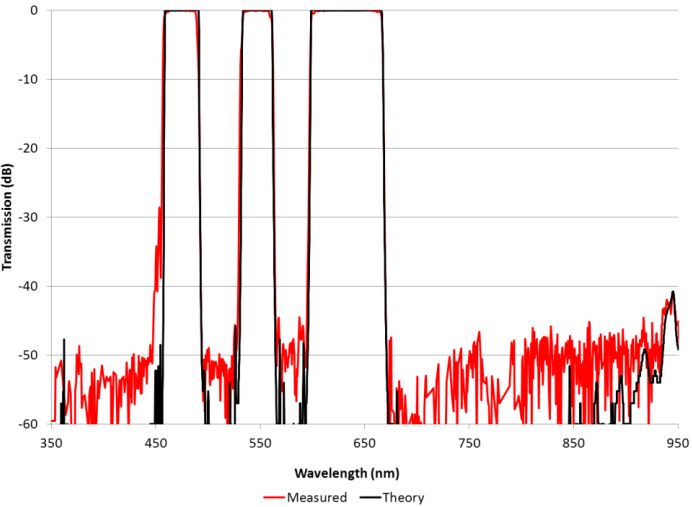
Figure 11. Triband optical filter showing limit of blocking measurements.
In cases such as this when the performance of even the best spectrophotometer is insufficient to measure the blocking level of these types of filters, an accepted industry approach is to use the “Slope Method” illustrated in Figure 12.
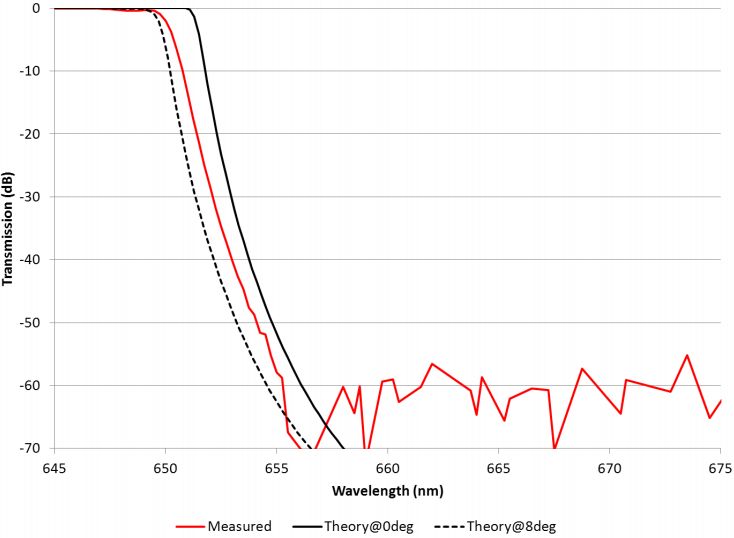
Figure 12. Use of the Slope Method to determine wavelength of -70dB (7 OD) blocking level.
This consists of taking the theoretical design and, using knowledge of the measurement technique, such as the rounding of the filter edge at the top, to fit the slope of the theory to that of the measured trace. If the fit is good, the slope of the theory may then be used to extend the measurement into the noisy region. Given a good understanding of the way that possible errors in the optical filter would show up in the measurement, along with supplementary measurements to eliminate the possibility of pinholes and other issues, this approach can extend the measurement limit by another 10 or 20 dB (1 or 2 OD). There is some uncertainty in such an approach, but the alternative of developing very expensive measurement equipment and techniques in house, if it is even possible for the particular wavelengths and blocking levels involved, and therefore resulting in much more expensive filters, has made this technique of great value.
Summary
The performance of advanced thin films as demonstrated by Alluxa’s thin films are challenging even the best metrology equipment and techniques. In this paper we have described a number of simple techniques, such as reference beam attenuation, placement of apertures in the sample beam, and appropriate use of spectral slit widths and scan speeds. These techniques, combined with knowledge of the theoretical filter performance, can greatly improve the accuracy of nearly all spectrophotometer measurements of today’s most advanced thin film filters.
Why Alluxa?
Alluxa’s team of experts has delivered key innovations to the field of optical thin-films. In addition to designing and constructing all of our own custom optical thin-film coating equipment, we invented a novel plasma deposition coating process that both increases the performance of our optical filters and decreases the time it takes to produce them.
By combining these innovations with state-of-the-art automation, proprietary control algorithms, and precision monitoring during the coating process, we are able to deliver low-cost, high-performance, custom thin-film optical filters for any application.
