

Alluxa Introduces HELIX™ Spectral Analysis System for Measuring High-Performance Thin-Film Optical Filters
HELIX™ Spectral Analysis System accurately measures the highest-performance optical filters.
The HELIX Spectral Analysis System has redefined measurement capabilities of high performance thin-film optical filters. HELIX is an instrument designed and developed by Alluxa Engineering staff to address the limitations of most commercially available spectrophotometers. The system’s capabilities are four-fold: it is able to track filter edges to OD7 (-70 dB), evaluate blocking to OD9 (-90 dB), resolve edges as steep as 0.4% relative to edge wavelength from 90% transmission to OD7, and resolve passbands that are as narrow as 0.1 nm at full width half maximum (FWHM).
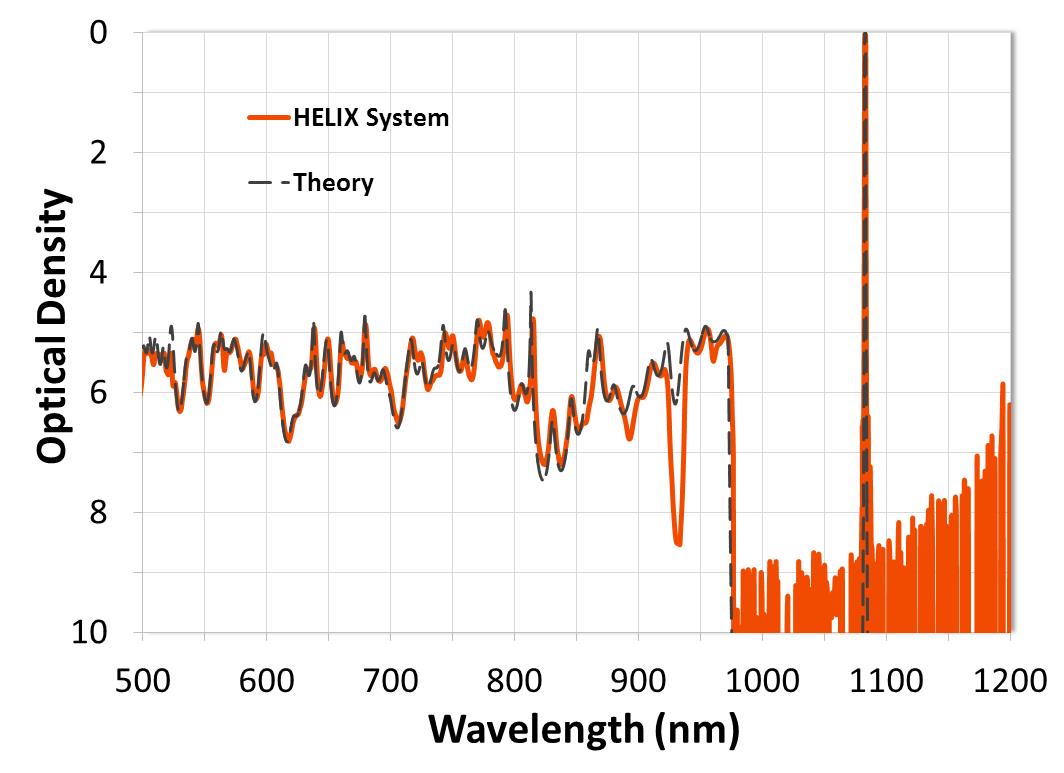
Figure 1. Transmission spectra of a high-cavity-count ultra-narrow bandpass filter measured with the HELIX System and compared to theory. The HELIX System is able to measure blocking up to a level of OD9 (-90 dB).
1. Overview
An increased demand for high-performance optical filters with edge transitions steeper than 0.5% of edge wavelength from 90% transmission to OD6 (-60 dB), wide-range blocking beyond OD6, and ultra-narrow filters with sub-nanometer bandwidths has driven recent advancements in thin-film design and coating technologies. However, measuring the true spectral performance of these filters is particularly challenging due to the inherent limitations of standard spectrophotometers and other grating-based measurement systems. These limitations render the instrument incapable of resolving ultra-steep edges or very narrow passbands, resulting in measured transmission spectra that depict inaccurate bandwidths and rounded peaks of ultra-narrow filters, smeared and rounded edges, and noise floors that range between OD2 (-20 dB) and OD7. This can be frustrating for technologists who require measured data that demonstrates the true performance of optical filters prior to the qualification phase of system development. Also for coating manufacturers, who are tasked with making filters that meet the demanding requirements even though performance is virtually impossible to measure in most cases.
For this reason, many thin-film manufacturers have started utilizing tunable lasers, custom-built spectrophotometers, and other advanced methods to obtain more accurate measurements. Unfortunately, many of these solutions can be cost prohibitive, sensitive to misalignment, or have a limited wavelength range, and so are not ideal for use in a high-volume manufacturing scenario. Fortunately, Alluxa has developed the HELIX Spectral Analysis System, a custom solution that is capable of measuring blocking to OD9 (Figure 1), tracing edges to OD7, and accurately resolving both sub-nanometer passbands and edge transitions that are as steep as 0.4% of edge wavelength from 90% transmission to OD7.
2. Traditional Measurement Techniques and Limitations
2.1 Spectrophotometers and grating-based measurement systems
In the thin-film industry, spectral measurements of optical filters are most commonly obtained through the use of a double-monochromator-based spectrophotometer. These and other grating-based measurement systems determine optical filter transmission by means of a broadband light source used in conjunction with monochromators that are composed of a diffraction grating and a series of slits and mirrors. As broadband light strikes the first diffraction grating, it is dispersed into its component wavelengths, with each reflecting off of the grating at a slightly different angle. By rotating the grating, the monochromator is able to sequentially project each wavelength, or band of wavelengths, through a slit. The beam then travels to a second monochromator or grating in order to reduce the stray light in the system before it finally exits through another adjustable slit that further narrows the spectral bandwidth (SBW) (Figure 2). By adjusting the slit-width, both light intensity and spectral resolution are able to be controlled.
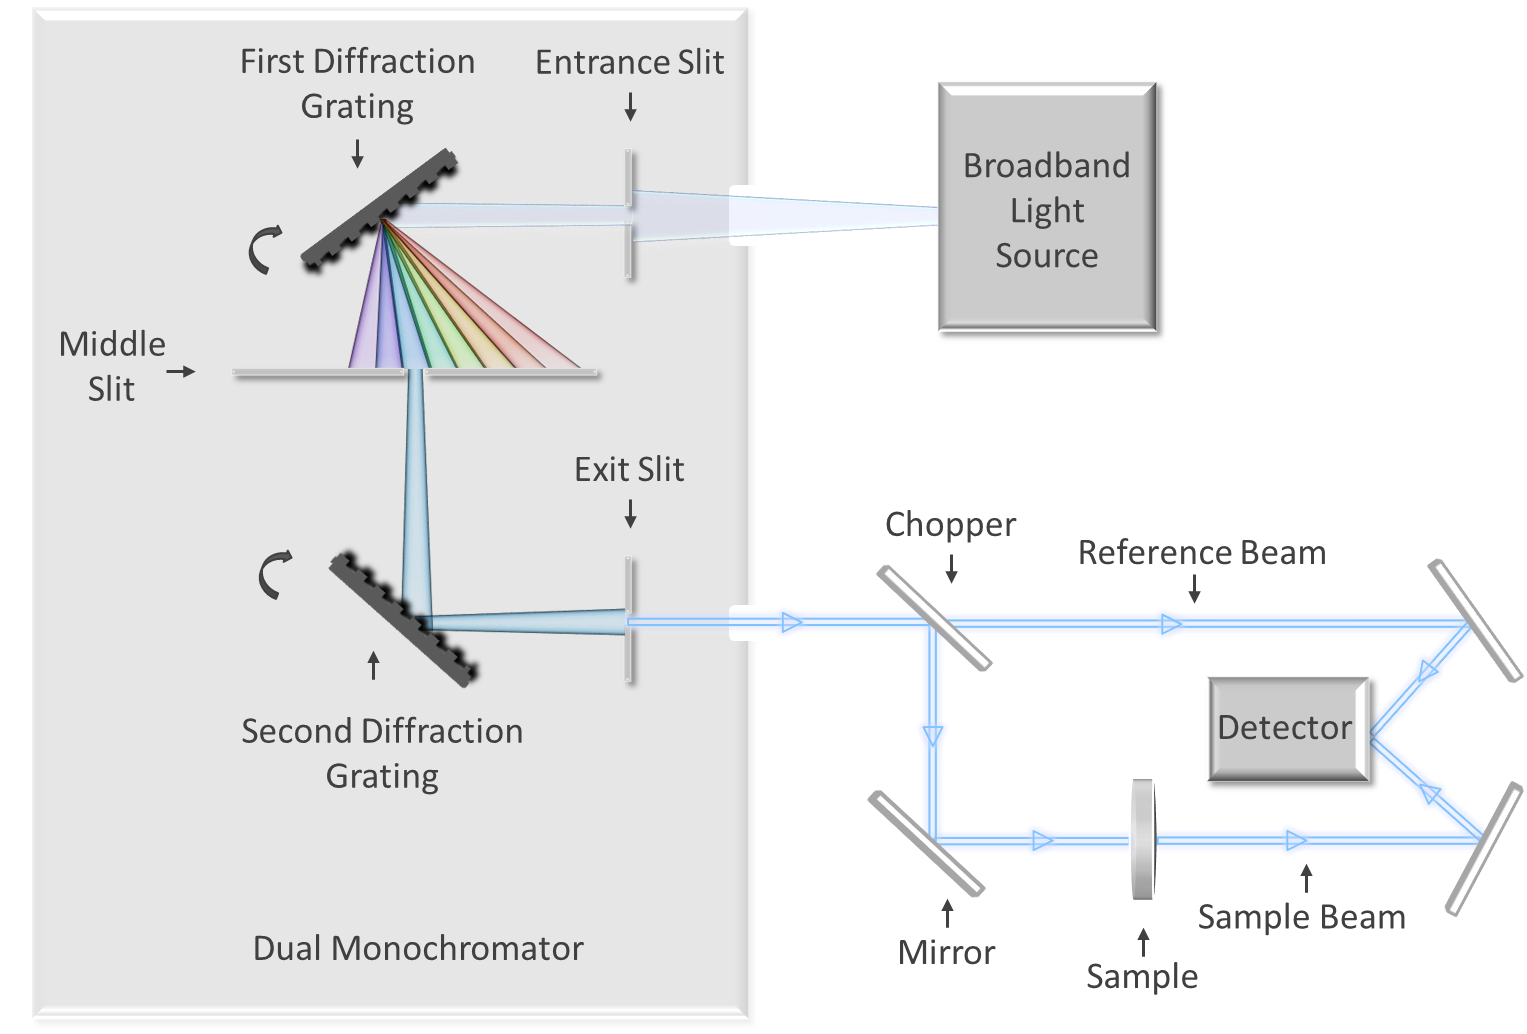
Figure 2. Simplified diagram of a dual-monochomator-based spectrophotometer.
In thin-film metrology, achieving high spectral resolution is imperative because many optical filters are designed with steep transitions from high transmission to deep blocking over a short wavelength range. If the spectral resolution is relatively coarse, the measurement will yield a smeared and rounded edge that is not representative of the true steepness of the filter. This inability to resolve transitions over a short wavelength range is also true for filters with ultra-narrow bandwidths. For these, the effect of edge smearing is further compounded since the bandwidth is close in value to the spectral resolution of the instrument. This ultimately results in an unresolved passband, with the final measurement showing a rounded peak and relatively low transmission.
The spectral resolution of a spectrophotometer can be improved by narrowing the exit slit, thereby reducing the SBW of the light that passes through. However, even if the SBW is minimized, a certain amount of edge smearing will still be seen because of the relatively large cone angle (small f-number) and spot size of the incident beam. Spot size is an important consideration when measuring thin-film filters because the spatial uniformity gradient of the coating results in a slight shift of the filter edges and bands depending on the location of the incident beam. If the spot size is large, the measurement will show edge smearing that results from an averaging effect over all filter locations that fall into the beam.
Likewise, the f-number of the incident beam is important in thin-film metrology because the spectral response of optical filters is angle dependent. At increasing angles of incidence (AOI), optical filter spectra shift down in wavelength at a rate that is determined by the effective refractive index of the filter. Additionally, polarization splitting can result in a distorted spectral shape when AOI is large. Since light from an incident beam with a small f-number strikes the filter at all angles in the range of the cone, an averaging effect occurs that results in smeared edges and rounded passbands.Therefore, in addition to narrowing the exit slit, edge smearing can be minimized by introducing a small aperture to reduce the beam size and cone angle of the incident light. However, since light intensity is reduced by both decreasing the slit-width and introducing apertures, the signal-to-noise ratio is also decreased, which ultimately results in a noise floor that is raised by several orders of magnitude. Therefore, these techniques are useful for resolving marginally steep optical filter edges to a level of approximately OD2 or OD3, but cannot be used to evaluate attenuation beyond that level (Figures 3a and 3b).
Conversely, widening the slit and completely removing any apertures will increase the light intensity and lower the noise floor. Attenuating the reference beam, a technique referred to as Rear Beam Attenuation (RBA), will help to further lower the noise floor by biasing the dynamic range of the detector, thus increasing the signal-to-noise ratio. These techniques are useful for evaluating blocking to a level of OD6 or OD7, which is the maximum noise floor of most spectrophotometers due to the scattered light normally present in the system. However, they also present a trade-off because the increased light intensity is achieved by increasing the SBW, which results in coarser spectral resolution. Even for standard-performance optical filters, a measurement using these techniques will show distorted edges and inaccurate bandwidths because the edge transitions from high transmission to deep blocking rival the spectral resolution of the measurement (Figures 3a and 3b).
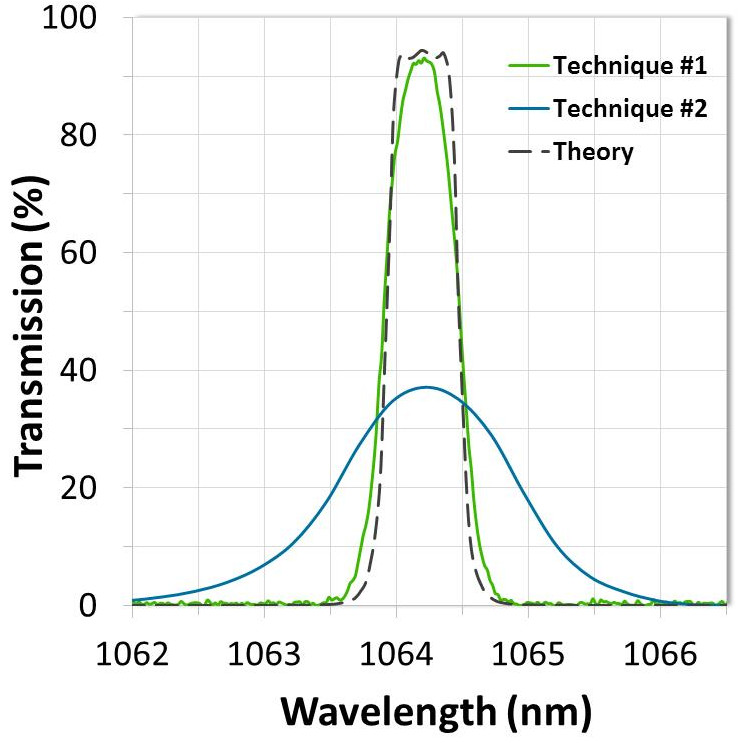
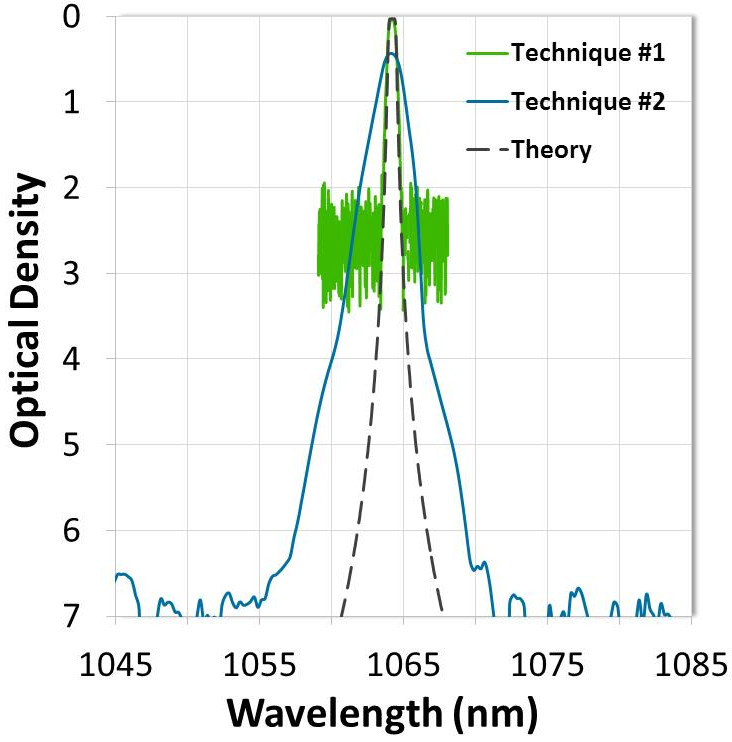
Figures 3a & 3b. Comparison of two different techniques used to measure the same bandpass filter: (1) narrow slit with a small aperture introduced and (2) wide slit with the aperture removed and a rear beam attenuator introduced.
For many standard filters, a measurement with minimal edge distortion and a noise floor of OD4 or OD5 can be achieved with a moderate SBW setting and by introducing a relatively wide aperture. However, all techniques mentioned are insufficient for measuring and evaluating steep edges, blocking beyond OD6, or ultra-narrow bandpass filters.
2.2 Advanced and custom measurement options
Many off-the-shelf spectrophotometers contain built-in light sources and diffraction gratings that suit the UV, visible, and /or IR measurement range of interest. The instrument automatically switches light sources and gratings at the appropriate time, producing a seamless dataset. However, these built-in components cannot be easily switched out for higher-powered light sources that would improve signal-to-noise ratios, or diffraction gratings with greater line densities that would improve spectral resolution. Therefore, customization of grating-based measurement systems is required in order to improve measurement capability.
This can be accomplished by constructing a custom spectrophotometer in an optics lab. This option allows for the integration of multiple customizable monochromators into the system, which have the potential to lower the noise floor to OD8 (-80 dB) for a double monochromator, or OD12 (-120 dB) for a triple monochromator. However, these systems can be sensitive to misalignment, background light, and other environmental conditions unless they are fully contained in a custom-built enclosure. Another option would be to customize an existing off-the-shelf system, although the majority of these are designed without the intent to modify in order to avoid issues pertaining to warranty and repair.
Some of the most precise and accurate measurements of optical filters are made by using tunable lasers instead of grating-based systems. Due to the increased power output, collimated beam, and well-defined wavelength, tunable lasers are able to produce accurate, high OD measurements with very fine spectral resolution at each wavelength within their range. However, since the wavelength range of most tunable lasers is relatively narrow, multiple lasers would need to be used to measure the full transmission and blocking ranges of a single filter. Tunable lasers are also expensive to purchase and maintain, therefore they are not ideal for use in high-volume manufacturing scenarios.
3. HELIX Spectral Analysis System
3.1 System Overview
The HELIX Spectral Analysis System is a custom solution that minimizes the trade-off between light intensity and spectral resolution, while achieving a large f-number and small spot size. It was developed by integrating a high-powered laser source into a double-monochromator system. Through the high-intensity collimated light of this custom configuration, high spectral resolution is able to be achieved without raising the noise floor. The result is a system with a wavelength accuracy of up to ± 0.05 nm and a spectral resolution of up to 0.01 nm that is capable of precisely and accurately measuring the highest-performance optical filters.
3.2 Resolving Steep Edges
Because the HELIX System is able to obtain high spectral resolution measurements without raising the noise floor, it is capable of accurately resolving steep edges all the way to OD7 (Figure 4). This is especially useful for evaluating filters used in applications such as Raman spectroscopy and Raman LIDAR. In these applications, optical filters are designed to provide over 90% transmission of the Raman signal while attenuating the laser line or associated Rayleigh signal to a level of OD6 or greater. Since the separation between target signal and laser line can be 1 nm or less in some cases[1], many optical filters are necessarily designed to be steeper than 0.5% of edge wavelength from 90% transmission to OD6.
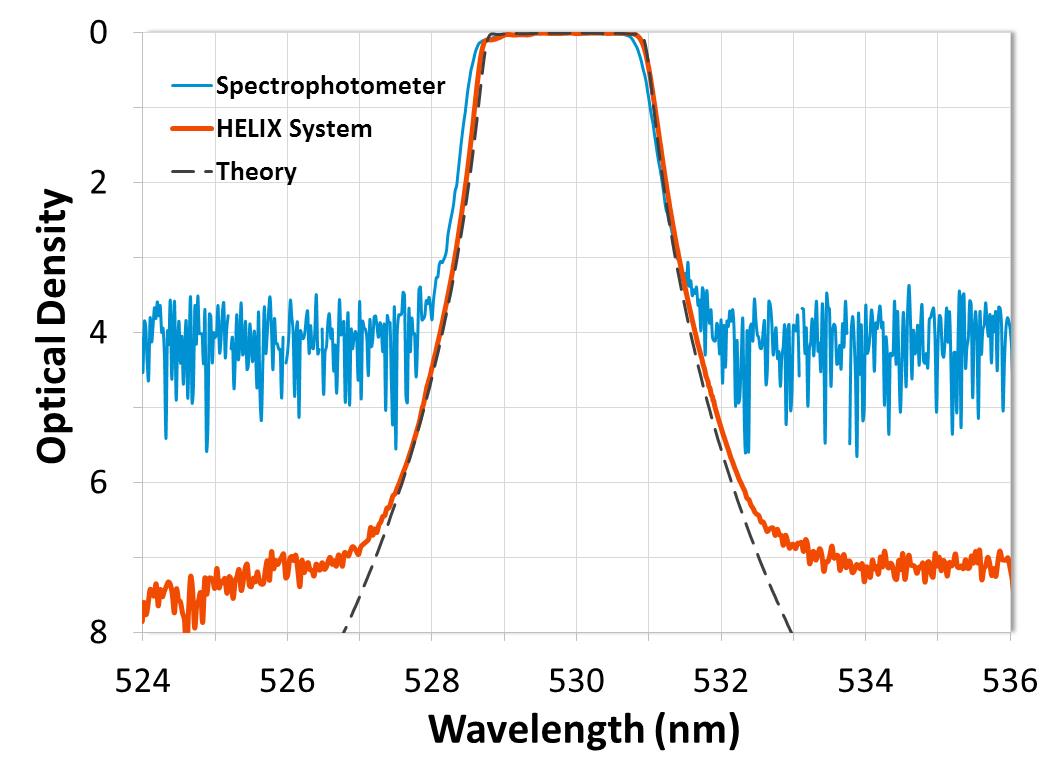
Figure 4. Measurement comparison of a Raman LIDAR filter designed with a slope of < 0.1% of edge wavelength from 90% transmission to OD4 (-40 dB). Two identical filters were designed to be used in series to provide OD8 (-80 dB) blocking of the 532 nm Rayleigh signal. The HELIX System resolved edges to OD 7 (-70 dB).
Since optical filters with this level of edge steepness are difficult to measure using standard methods, many thin-film manufacturers evaluate edges by using the corresponding theory trace to extrapolate edge locations beyond the noise floor of the spectrophotometer. However, this method only provides a rough estimate of the blocking level at the specified wavelength and does not consider influencers that could affect absolute achievable blocking, which could vary from run to run or from filter to filter. For optical filters with extremely tight edge transitions, determining the exact attenuation level at a specified wavelength along the edge is crucial in order to guarantee that the filter will perform as designed. Therefore, the HELIX System is instrumental in determining the true performance of these filters.
3.3 Measuring wide-range blocking
Many applications, such as flow cytometry, fluorescence imaging, and Mie, Rayleigh, and Raman LIDAR, require filters with wide-range blocking at a level beyond OD7. Because the noise floor of most spectrophotometers cannot be extended much beyond OD6, many thin-film manufacturers need to specify blocking levels that are OD7 or greater as “by design.” This means that the filter design will exceed the specified blocking level, but the measurement may not. Unfortunately, even if the filter is designed with blocking well beyond the specified level, errors during the coating process, pinholes and surface imperfections, and / or other defects that produce light scattering in the filter assembly can reduce the attenuation level of the finished product.
Since the HELIX System is capable of making wide-range high OD measurements (Figure 5), it is able to identify filters that do not meet the required attenuation level, guaranteeing optimal system performance.
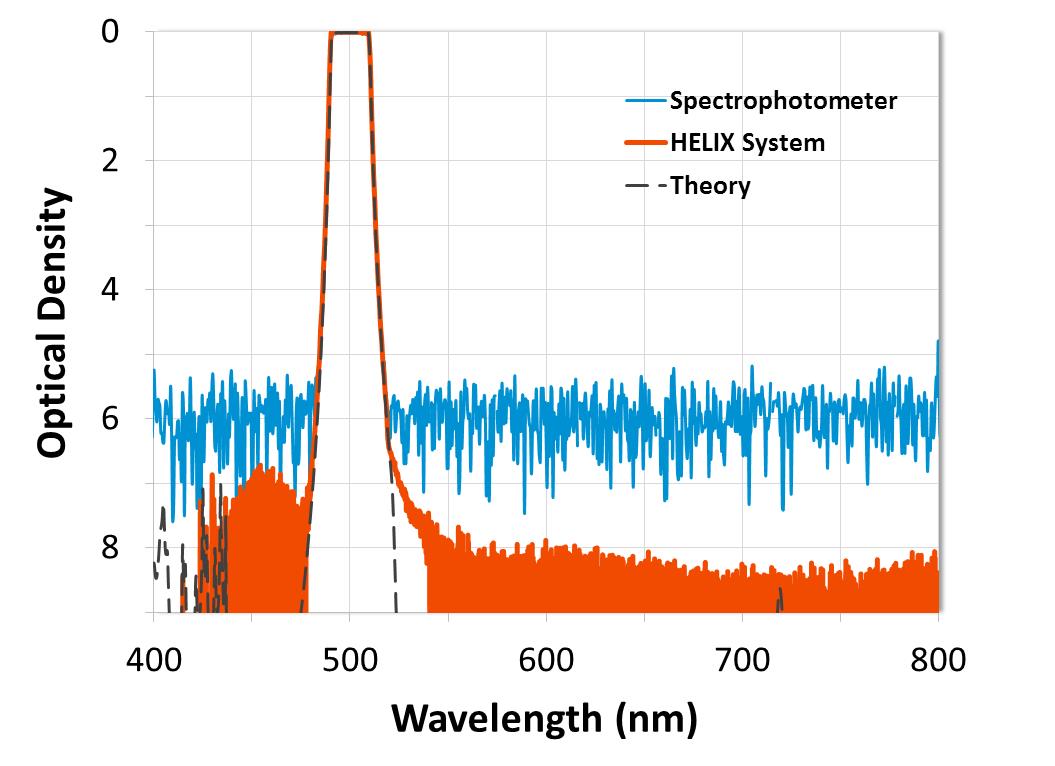
Figure 5. Measurement comparison of a high-performance fluorescence filter designed with steep edges and greater than OD8 (-80 dB) blocking. Data from the HELIX System shows filter edges resolved to OD7 (-70 dB) and wide-range blocking at a level of OD8.
3.4 Measuring Ultra-Narrow Bandpass Filters
As mentioned, ultra-narrow bandpass filters are difficult to measure because the sub-nanometer bandwidth rivals the spectral resolution of most spectrophotometers, resulting in a measurement with a rounded peak, low transmission, smeared edges, and an inaccurate bandwidth.
This effect can be seen in ultra-narrow filters with standard edge steepness and bandwidths that are less than 1 nm at FWHM. However, the most dramatic distortions are seen in high-performance ultra-narrow filters that are designed for use in LIDAR, solar imaging, and laser applications. These filters can be designed with bandwidths that are as narrow as 0.1 nm at FWHM, and many are designed with a high-cavity count, giving the filter a flat top, steep edges, and a square spectral shape[2]. However, because both the bandwidth and the edge steepness of these filters requires much higher spectral resolution than what is available through most spectrophotometers, the square shape is rarely represented in standard measurements (Figure 6), particularly when the FWHM is less than 0.5 nm.
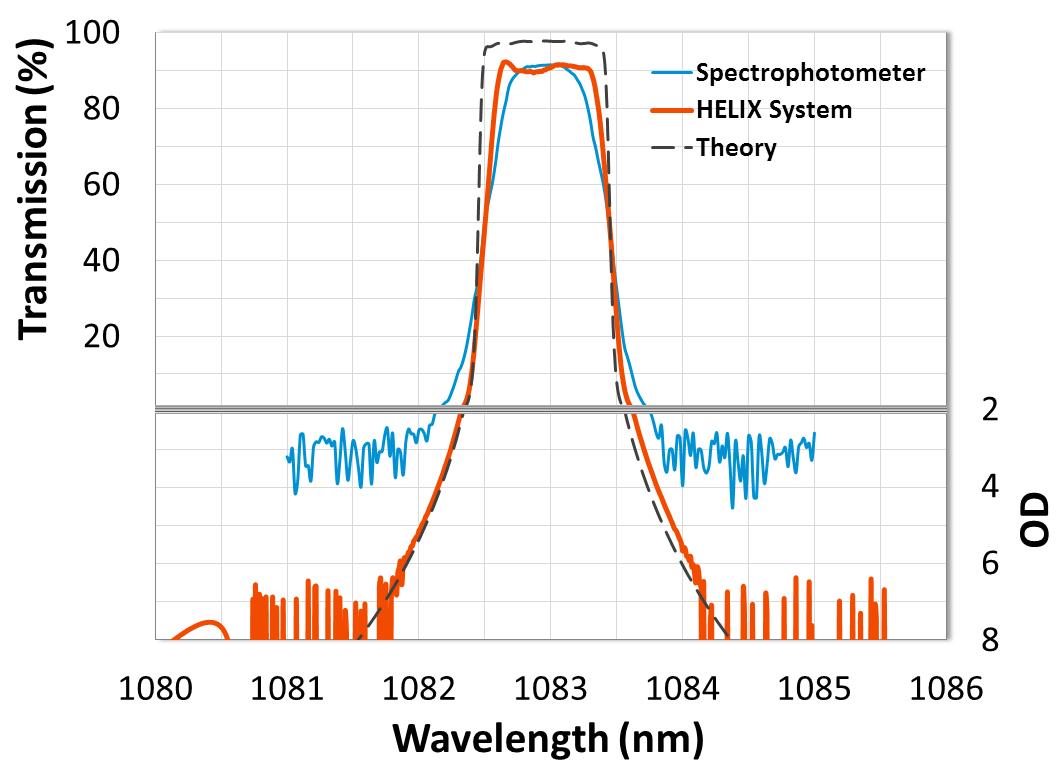
Figure 6. Measurement comparison of a 1083 nm high-cavity-count ultra-narrow bandpass filter. Data from the HELIX System shows a completely resolved square passband and steep edges measured to OD7 (-70 dB).
Since the peak transmission of ultra-narrow bandpass filters is difficult to measure using standard methods, it is necessary for manufacturers to specify high transmission requirements as “by design” for many filters with sub-nanometer bandwidths. However, when high-performance ultra-narrow bandpass filters are measured using the HELIX System, even the steepest and narrowest passbands are able to be completely resolved (Figure 7) and the edges traced all the way to OD7. This allows for the evaluation of the true peak transmission, spectral shape, edge steepness, and FWHM of the filter.
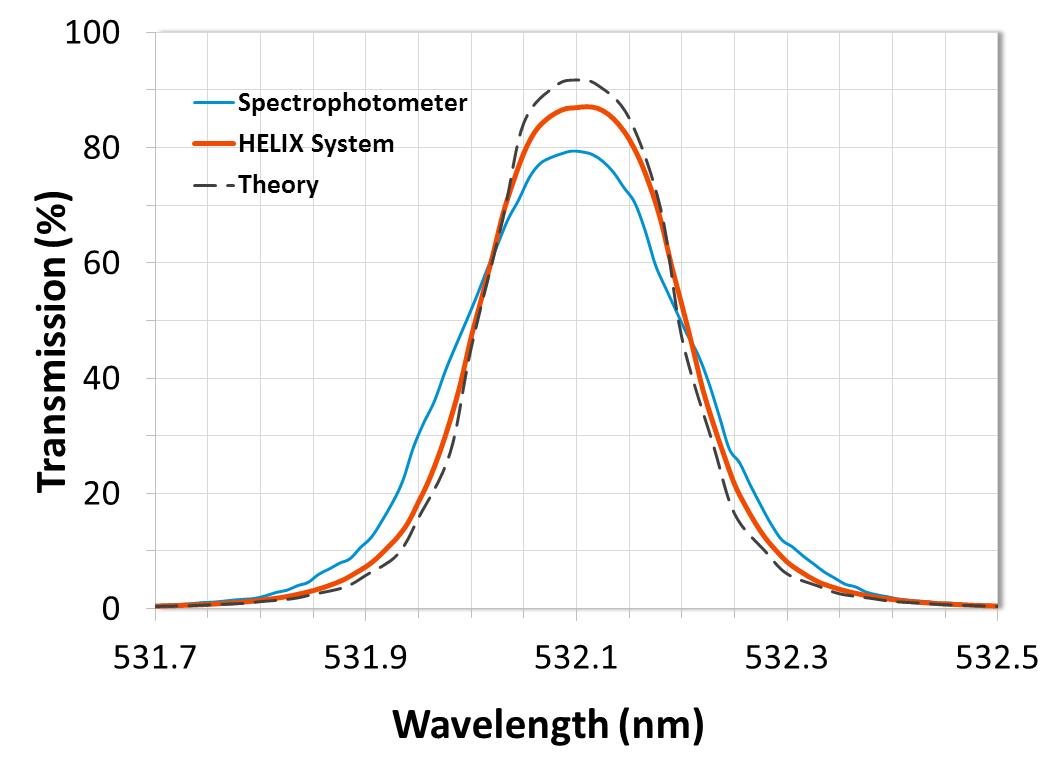
Figure 7. Measurement comparison of a 0.2 nm FWHM ultra-narrow bandpass filter. Data from the HELIX System shows a completely resolved passband.
3.5 Measuring Notch Filters
Notch filters present a unique metrological challenge to thin-film manufacturers because they are designed to attenuate a relatively small wavelength range while transmitting the adjacent spectrum on either side. Since so much light is transmitted through the filter during the measurement process, there is an increased amount of stray light that makes its way to the detector. When that happens, the signal-to-noise ratio decreases, and the noise floor of the measurement is raised. Even though stray light is typically present in the spectrophotometer, it poses less of a problem for filters that attenuate in the working range of the detector, like bandpass filters.
Although stray light cannot be eliminated, the HELIX System is still able to achieve measurements that extend beyond OD7 for narrow notch filters (Figure 8), and beyond OD8 for wider notches (Figure 9).
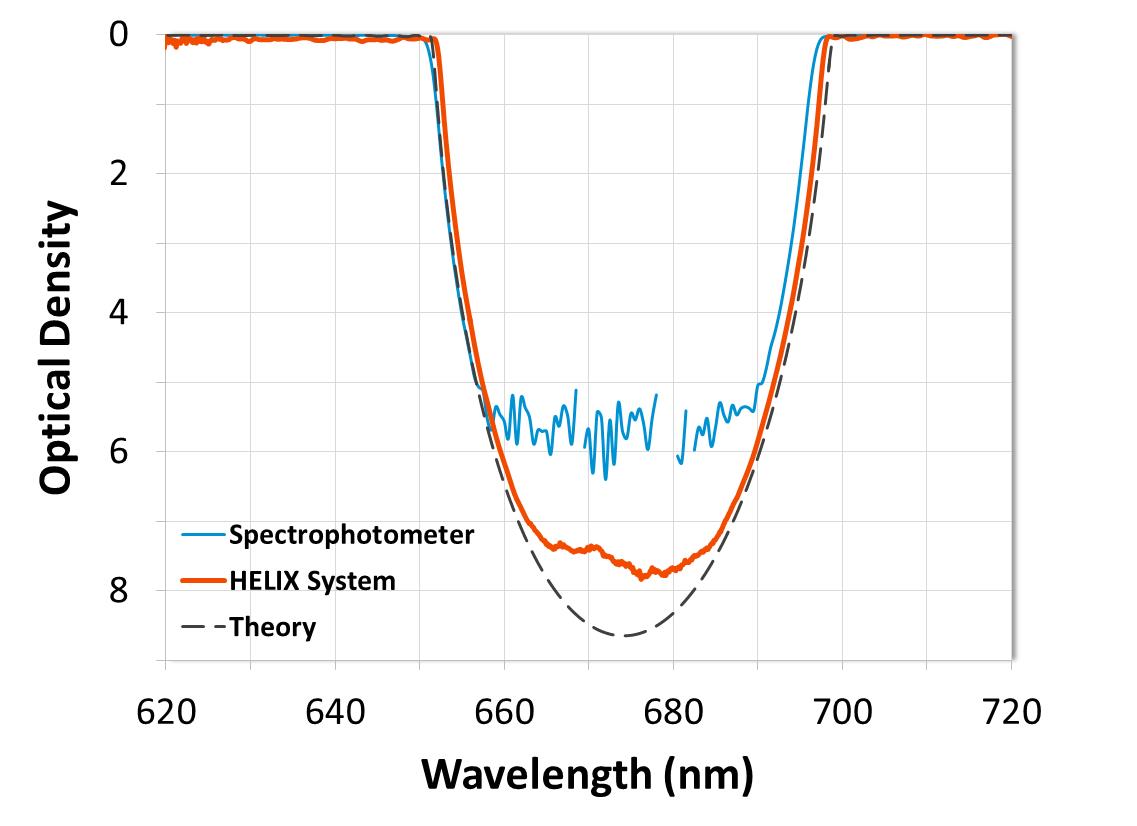
Figure 8. Measurement comparison of a narrow notch filter. Data from the HELIX System shows blocking measured to OD7 (-70 dB).
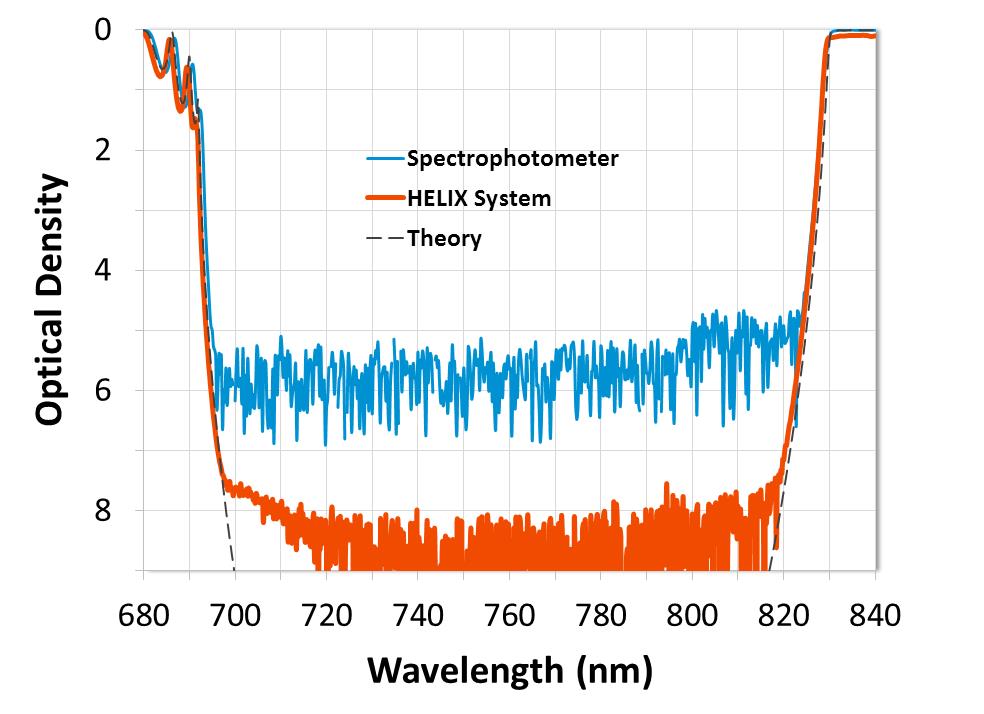
Figure 9. Measurement comparison of a wide notch filter. Data from the HELIX System shows blocking measured to OD8 (-80 dB).
4. Summary
Alluxa has developed a custom spectral analysis system that is capable of accurately measuring the highest-performance optical filters, while still being robust enough for use in a high-volume manufacturing setting. The HELIX System is an essential tool for evaluating true optical filter performance, guaranteeing that Alluxa’s filters will meet and exceed the demanding requirements of even the most advanced systems.
Literature Cited
[1] Alannah Johansen, Amber Czajkowski, Mike Scobey, Peter Egerton, and Rance Fortenberry, PhD (2017). Thin-Film Interference Filters for LIDAR. Alluxa White Paper Series. https://alluxa.com/category/learning-center/.
[2] Alluxa engineering staff (2012). Flat Top, Ultra-Narrow Bandpass Optical Filters Using Plasma Deposited Hard Oxide Coatings. Alluxa White Paper Series. https://alluxa.com/category/learning-center/.
Why Alluxa?
Alluxa’s team of experts has delivered key innovations to the field of optical thin-films. In addition to designing and constructing all of our own custom optical thin-film coating equipment, we invented a novel plasma deposition coating process that both increases the performance of our optical filters and decreases the time it takes to produce them.
By combining these innovations with state-of-the-art automation, proprietary control algorithms, and precision monitoring during the coating process, we are able to deliver low-cost, high-performance, custom thin-film optical filters for any application.
Contact Alluxa for more information at info@alluxa.com
or visit our website at https://alluxa.com
All content copyright ©2020 Alluxa, Inc.
